San Francisco’s Plan to Reduce Homelessness
San Francisco Urgently Needs Real Solutions to Address Homelessness.
The City has a plan, but it requires all of us to do more and up our game. This is the place to track progress.
WATCH
A Promising Plan
In 2023, approximately 7,800 people in San Francisco were experiencing homelessness at any given time. Of this group, more than half were unsheltered, sleeping on the street or in places like tents or cars. The rest were sheltered, meaning they had a temporary place to sleep in a homeless shelter.
In July of 2023, the City began a five-year plan to decrease the number of people who are unsheltered by 50% and the total number of people experiencing homelessness by 15%.
Transparency into the data is crucial, which is why Tipping Point has launched its San Francisco Homelessness Dashboard.
When this plan is successful, we will be well on our way to a new and better version of San Francisco where each one of our neighbors has a safe place to call home.
Experts Agree: The City’s Plan is Sound.
Follow The Data to Track Progress.
If we work together, San Francisco’s plan is realistic and within reach. The plan’s success, however, requires financial resources, political commitments, and improved programs that address the unique needs of people experiencing homelessness.
In November 2023, Tipping Point launched the following dashboard to measure progress towards the City’s 5-Year Plan. This dashboard highlights five key metrics that, taken together, provide a strong indication of whether or not we’re moving in the right direction. These metrics range from data about preventing homelessness in the first place, to improving access to temporary shelter, to helping people find permanent housing. We are also keeping an eye on the City’s ability to increase the number of affordable housing units as well as the demographic breakdown of those experiencing homelessness to understand racial disparities.
The dashboard is updated monthly based on data collected and made available by the City and County of San Francisco, with direct sources linked below. All graphs are based on fiscal year unless otherwise stated. While we strive to display the most accurate and timely data available, the City is continually refining its data collection process and certain data may not be available for update on a monthly basis. For more information about the City’s data collection and our distribution process, contact our team. Dashboard last updated: August 12, 2025.
San Francisco needs more shelter beds to help people stabilize and connect to permanent housing. The City’s plan calculates that reaching a total of 4,575 shelter beds is a key factor toward reducing unsheltered homelessness by 50%. While the city has added new shelter beds in past years, this is a significant expansion. In the prior 10-year period, shelter inventory has not exceeded 3,500 beds.
This dashboard tracks three data points related to this goal. The first is how many beds are available at any given time; note that capacity can change rapidly based on circumstances (for example, a COVID outbreak that causes closure of a site, or shelters adjusting the number of beds depending on need during colder versus warmer months). The second is how many beds have been added to the inventory. The third is the vacancy rate of beds in the shelter system.
The City’s goal of reducing the number of unsheltered residents draws a clear distinction between two categories of people experiencing homelessness— people living on the streets (“unsheltered”) as well as those in shelters (“sheltered”).
When coupled with a pathway to long-term housing, shelters offer an important stepping stone to stability. A safe place to sleep can provide a critical respite from the mental and physical strain of living on the streets. As illustrated in the next section, it is important to expand the number of permanent housing opportunities to ensure that the shelter system does not get clogged.
5-YEAR TOTAL INVENTORY PROGRESS
CURRENT
3,666
GOAL
4,575
SHELTER VACANCY
9%
PROGRESS TRACKING TOWARDS GOAL
- 5-year shelter goal: This goal is from the City’s strategic plan. The total goal listed of 4,575 beds is based on the City’s strategic plan goal to add 1,075 shelter beds to an estimated 3,500 starting beds.
- Progress on shelter beds: These data come from HSH’s shelter inventory dashboard. Visit that resource to learn more about what is included and excluded in these data. Note that the shelter dashboard may not include every shelter bed that will be counted to reach the City’s strategic plan goal (for example, it does not include privately-funded shelters).
- Shelter vacancy rate: These data come from HSH’s shelter inventory dashboard. Visit that resource to learn more about what is included and excluded in these data.
- Historical shelter bed inventory: These data come from the Housing Inventory Count and are reported to HUD once per year. This total includes the number of beds available in Emergency Shelters, Safe Havens and Transitional Housing and may not reflect the exact same inventory as the City reports for its own purposes. Increases and decreases near 2020 reflect changes due to COVID-19.
The solution to homelessness is a home. Moving people quickly into permanent, stable housing – often called “exits from homelessness” – is necessary to reduce the total number of people experiencing homelessness. This dashboard tracks three areas to help assess San Francisco’s progress: housing placements, housing stability, and a focus on one type of long-term housing called Permanent Supportive Housing (PSH).
Housing Placements:
Due to the shortage of affordable housing in San Francisco, people with low incomes are often forced to pay rents that exceed what they can afford. Ultimately, a percentage of these people lose their housing and become homeless. While many people are able to quickly find new housing for themselves and their families, others do not have the financial resources and social assets to do so and require help. Nonprofits, including some funded by Tipping Point, play a critical role in securing housing for people experiencing homelessness. To achieve the 30,000 housing placements goal, it is critical that the City provides a range of housing options because an intervention that works for one person might not work for the next. These options may include Permanent Supportive Housing, housing vouchers that help cover a portion of rent, and other forms of rental assistance. During Fiscal Year 2022-2023, about 2,600 people were placed into housing through the City’s Department of Homelessness and Supportive Housing. In the future, the City plans to include other types of housing placements in the total.
Housing Stability:
Simply placing people in housing does not equal success. It is important to ensure that when someone moves into housing, they have the resources to stay housed.
Experiencing homelessness causes a variety of life conditions which inevitably result in trauma. That trauma often becomes a risk factor to recurring bouts of homelessness. This is especially true for people who are living with a physical disability, have substance use disorders, or struggle with mental health issues. The stability rate is an important measure of the homelessness response system’s effectiveness.
Focus on Permanent Supportive Housing:
Permanent Supportive Housing (PSH) is a highly effective type of housing intervention for the most vulnerable people in our community. By combining deeply affordable units and supportive services, PSH strategies have a track record of success in San Francisco and throughout the county. Nearly four in 10 people experiencing homelessness in San Francisco have a disability, have been on the streets for a long period of time, and are excellent candidates for PSH.
At the start of the plan, there were roughly 14,000 PSH units in San Francisco, and the City has set a goal to add more units, along with other permanent housing options. Tipping Point is tracking PSH vacancy rates to ensure we are properly utilizing this critical recourse.
HOUSING PLACEMENTS
The City’s plan aims to place 30,000 people into housing over this five-year period to support its goal of reducing homelessness by 15%.
5-YEAR TOTAL PLACEMENTS PROGRESS
PROGRESS
6,658
GOAL
30,000
% OF GOAL
22.19%
PROGRESS TRACKING TOWARDS GOAL
- 5-year housing placements goal: This goal is from the City’s strategic plan.
- Progress on housing placements: These data come from the Housing Placement numbers reported out to the Homelessness Oversight Committee (HOC) in the HSH Director’s Report, which includes a delay in reporting prior months and may be adjusted retroactively. Note that future reporting from the City to calculate progress toward the 30,000 goal will include other housing placements not currently included in the Director’s Report. This will be updated as more data is made available.
- Historical progress on housing placements: These data come from the Housing Placement numbers reported in the HSH Director’s Reports. FY23 data comes from the September 2023 Director’s Report and FY22 data comes from the August 2022 Director’s Report.
- Note on Data: HSH recently released a Year 1 Progress Report of their strategic plan and reported 5,256 people exiting homelessness from July 1 2023 to June 30 2024. Please note this is due to the fact that, for this specific report, HSH reported on people, while this dashboard reports the number of households served. This dashboard will continue to report on households served each quarter, given that this is the data that HSH makes available on a quarterly basis. We will provide annual numbers when made available by HSH.
- Note on Data: Total number includes placements from PSH, RRH and Problem Solving. Housing Ladder is not considered a true exit and these numbers are excluded from this data point. Visit the HSH website to learn more about these Homelessness Response System interventions.
HOUSING STABILITY
It is important to ensure that when someone moves into housing, they have the resources and support to stay housed for the long-term. Stability rates are measured by looking at the percentage of people who remain housed over time. The City’s goal is to achieve an 85% stability rate, meaning at least 85% of people who exit homelessness do not experience it again.
STABILITY RATE OF TENANTS IN PERMANENT HOUSING
CURRENT RATE
83%
GOAL
85%
- 5-year housing stability goal: This goal is from the City’s strategic plan.
- Progress on housing stability: These data come from HSH’s Year One Progress Report (July 1 2023 to June 30 2024). This number will be reported annually.
PERMANENT SUPPORTIVE HOUSING
San Francisco has made important investments to increase the supply of Permanent Supportive Housing (PSH) over the years, which is the most of any county in the Bay Area. To ensure that units don’t sit empty unnecessarily, the City has a goal of a 7% vacancy rate across its site-based PSH.
PERMANENT SUPPORTIVE HOUSING INVENTORY PROGRESS
PERMANENT SUPPORTIVE HOUSING VACANCY RATE
VACANCY RATE
8.3%
GOAL
7%
- PSH vacancy rate: This number is tracked in the HSH PSH vacancy dashboard. Visit that resource to learn more about what is included and excluded in these data.
- PSH vacancy rate goal: This goal comes from HSH’s PSH dashboard.
- PSH inventory progress: For current data, visit HSH’s housing inventory dashboard. Visit that resource to learn more about what is included and excluded in these data. Prior years’ data come from the Housing Inventory Count and are reported to U.S. Department Housing & Urban Development
(HUD) once per year; HUD’s definitions and local definitions of PSH may not consistently align. - Note on Data: Refinements to the PSH inventory tracking process are still underway at HSH. PSH inventory data may fluctuate between March – May 2024 as data improvement efforts continue.
At its core, San Francisco’s homelessness crisis stems from a lack of housing that is affordable for people of different income levels. As is well documented, it takes multiple minimum-wage jobs to afford rent on an average one-bedroom apartment in San Francisco. Simply put, the supply of affordable housing does not meet the demand. Increasing the number of affordable housing units is the single most important thing San Francisco must do to address homelessness in the long run.
The State of California has required that San Francisco build a total of 82,069 new housing units, including 20,867 units for very low-income people, between 2023 and 2031 in order to meet the need for affordable housing. For comparison San Francisco only built 557 very low-income housing units in 2022 — but built 1,698 homes for above-moderate incomes.
Building more housing alone will not solve San Francisco’s housing and homelessness crisis. We need to significantly increase the number of homes available to households with very limited financial means.
The State of California has required that San Francisco build a total of 82,069 new housing units, including 20,867 units for very low-income people, between 2023 and 2031. This is part of the State’s Housing Element process, which identifies each county’s requirements to meet the housing needs of everyone in the community. Adding affordable units is a cornerstone of the San Francisco Housing Element which runs from 2023-2031. We are tracking this goal closely with a focus on homes built to serve our neighbors who are very low-income. Households with a combined income that is less than 50% of the Area Median Income qualify as very low-income. For example, in San Francisco in 2023, a single adult making about $50,000 a year, or a family of two (such as a single parent and child) making less than $57,000 a year, qualifies as very low income.
8-YEAR VERY LOW-INCOME HOMES PROGRESS
PROGRESS
282
GOAL
20,867
% OF GOAL
2.45%
- 8-year very low-income housing goal: This goal is set forth in the Housing Element.
- Progress on very low-income homes: These data are submitted to Housing and Community Development (HCD) yearly and reported out on their Housing Element dashboard.
- Historical progress on new homes: Data on new homes by income category can be found in the City’s 2022 Housing Inventory report.
The best way to address homelessness is to prevent it from occurring in the first place. The City’s plan projects that providing homelessness prevention support for 18,000 households is a key factor in reducing total homelessness by 15%.
The City measures progress towards this goal by the number of households that participate in homelessness prevention programs, including the San Francisco Emergency Rental Assistance Program. This program provides time-limited financial assistance to help households avoid homelessness.
Tackling homelessness requires two things: helping people experiencing homelessness get housed and preventing people at risk of homelessness from losing housing in the first place. Simply put, progress is only possible when the rate of people finding housing outpaces the rate of people losing housing.
Preventing someone from losing their housing is more cost-effective than the amount spent to re-house someone from the street or a shelter. Not surprisingly, once someone loses their housing, the very things that lead to stability become significantly more challenging, such as gaining employment, remaining healthy, and connecting to family.
The term homelessness prevention refers to a variety of services such as rental assistance, legal advice, landlord mediation, and/or helping a household find new housing if they need to relocate. In San Francisco, the Emergency Rental Assistance Program (SF ERAP) is available to provide financial assistance on a limited basis. The idea is that these funds will provide a temporary patch to keep someone housed at a moment when they might otherwise fall into homelessness.
The City’s strategic plan has a goal to deliver prevention services to 18,000 households from 2023 to 2031 through programs like SF ERAP. As of July 2023, there was funding identified to help approximately 13,700 households with homelessness prevention assistance. In the City’s strategic plan, they have set the goal of increasing funding to help an additional 4,300 households.
5-YEAR GOAL PROGRESS TRACKING
PROGRESS
8,897
GOAL
18,000
% OF GOAL
49.43%
- 5-year prevention goal: This goal is from the City’s strategic plan.
- Homelessness prevention progress: These data come from the Director’s Report to the Homelessness Oversight Commission.
- Note on Data: HSH recently released a Year One Progress Report of their strategic plan and reported 8,235 people prevented from experiencing homelessness from July 1 2023 to June 30 2024). This is due to the fact that, for this specific report only, HSH reported on people while this dashboard reports the number of households served. This dashboard will continue to report on households served each quarter, given that this is the data that HSH makes available on a quarterly basis. We will provide annual numbers when made available by HSH.
- Note on Data: Homeless prevention data is tracked by total progress, as both data sources are not broken out by year. This number includes prevention assistance funded and administered by HSH and MOHCD.
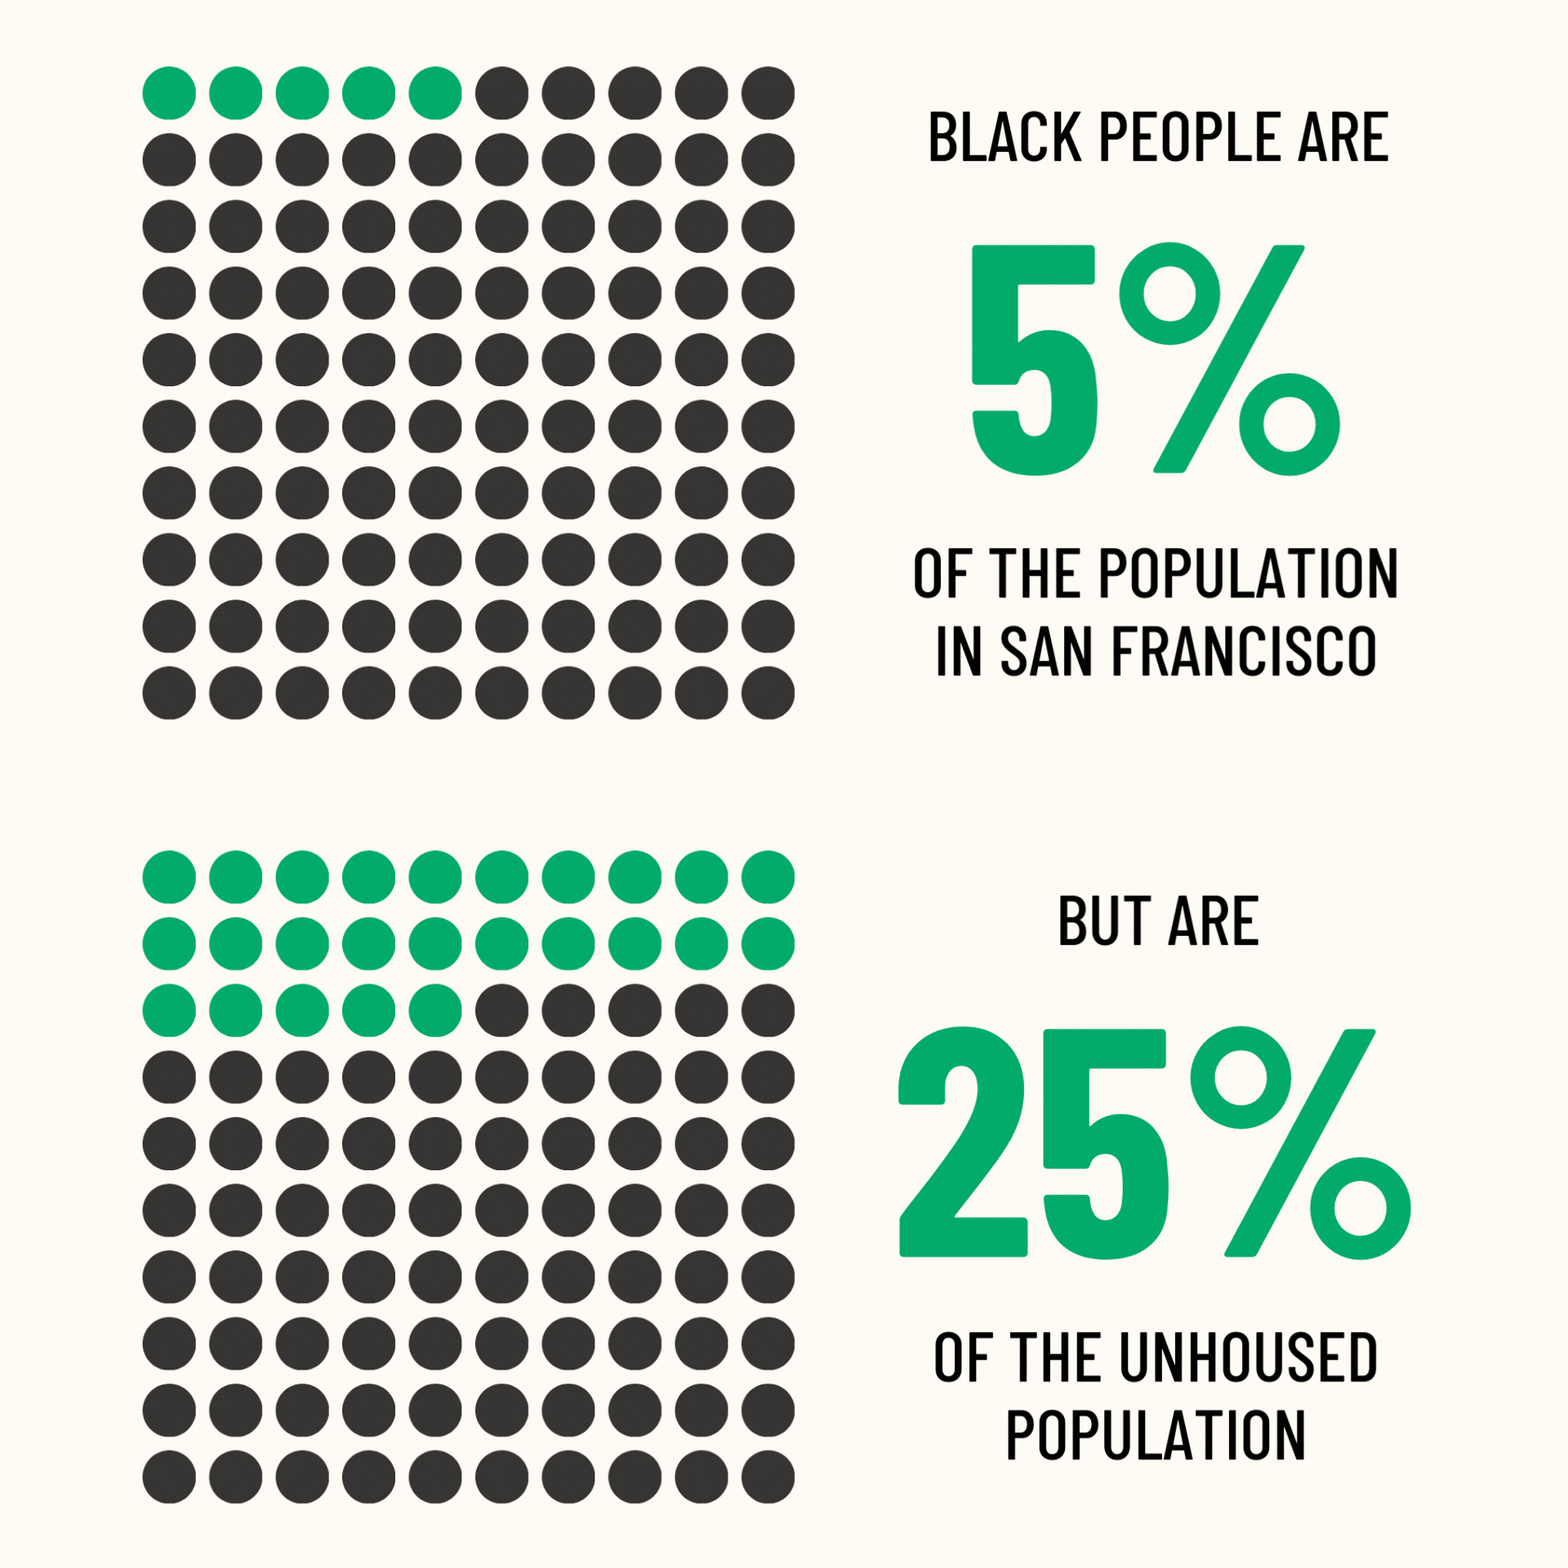
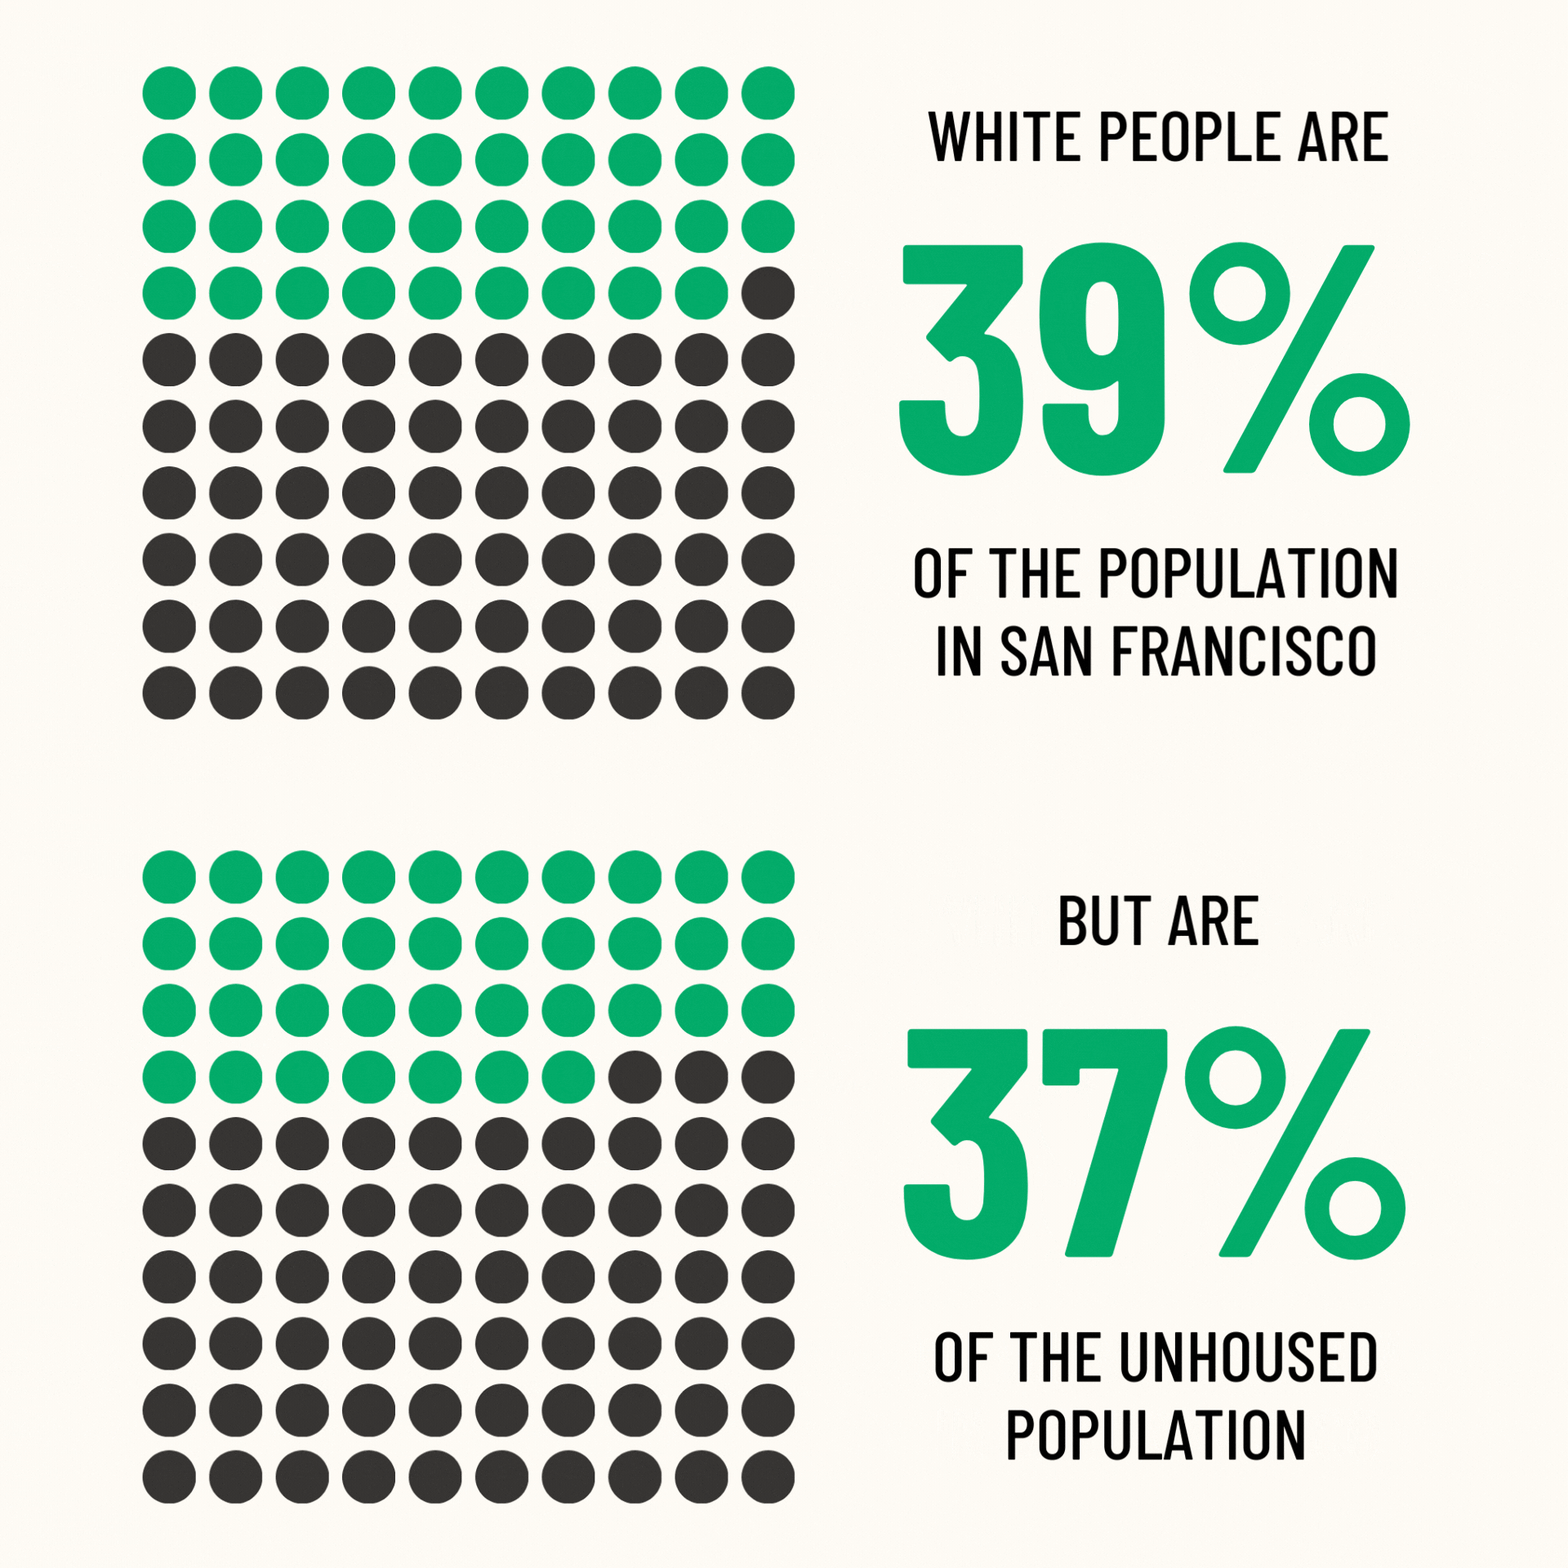
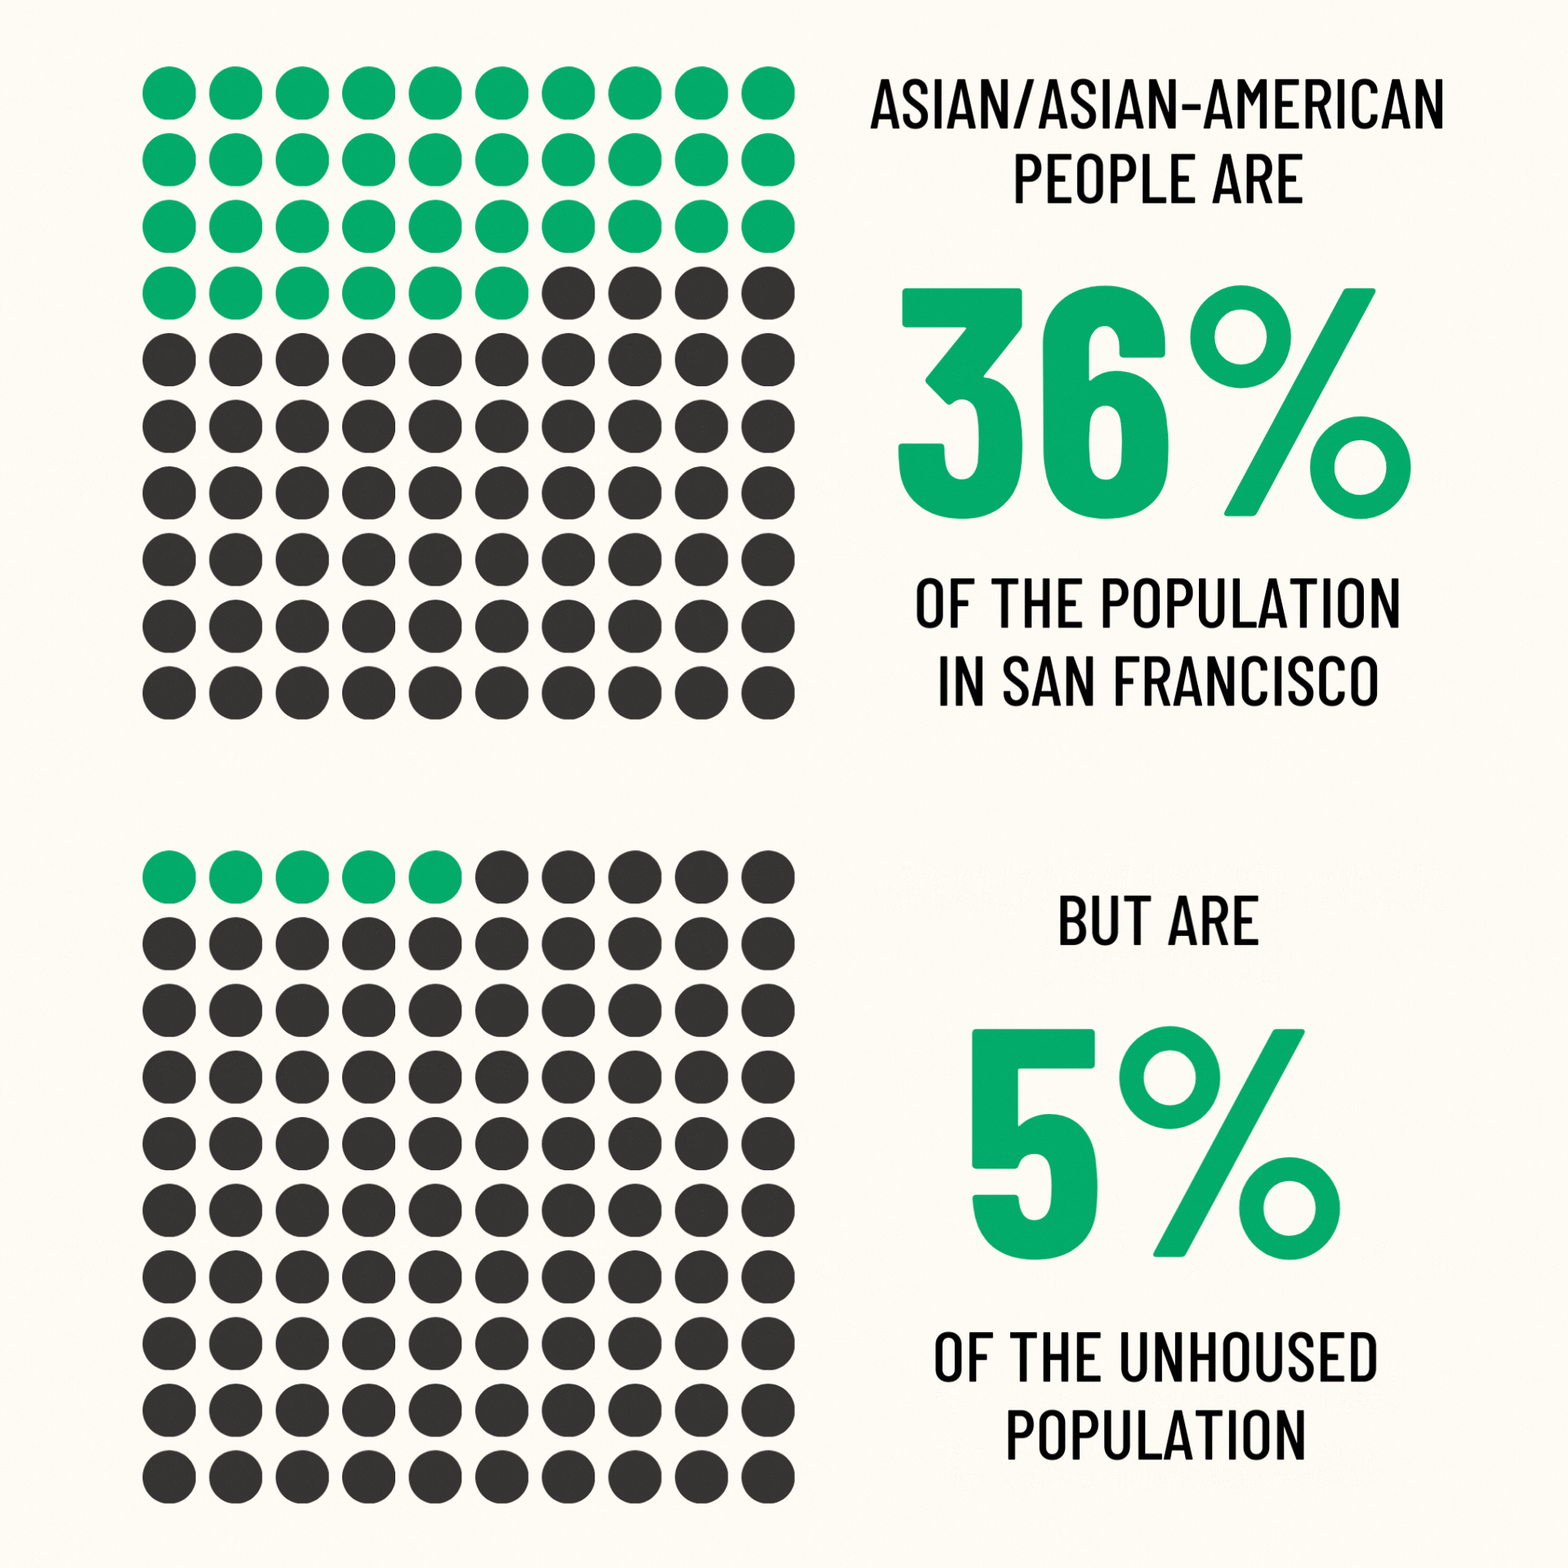
The risks and impacts of homelessness are not experienced equally across racial groups and ethnic groups. Currently, Black San Franciscans make up only 5% of the population, yet account for 25% of the population experiencing homelessness. While individual factors are one part of each person’s story, a legacy of discriminatory policies, such as limited access to capital, has played a significant role in creating these discrepancies. Today, two-thirds of people experiencing homelessness in San Francisco are people of color. To meaningfully reduce homelessness overall, we must target key drivers of racial disparities.
The City of San Francisco has set a goal of demonstrating measurable reductions in racial disparities among people experiencing homelessness. Despite the City committing to release baseline data around racial disparities by January 2024, they have yet to do so. As soon as they do, we will track that more timely data. In the interim, the data below is based on the biannual Point-in-Time Count.
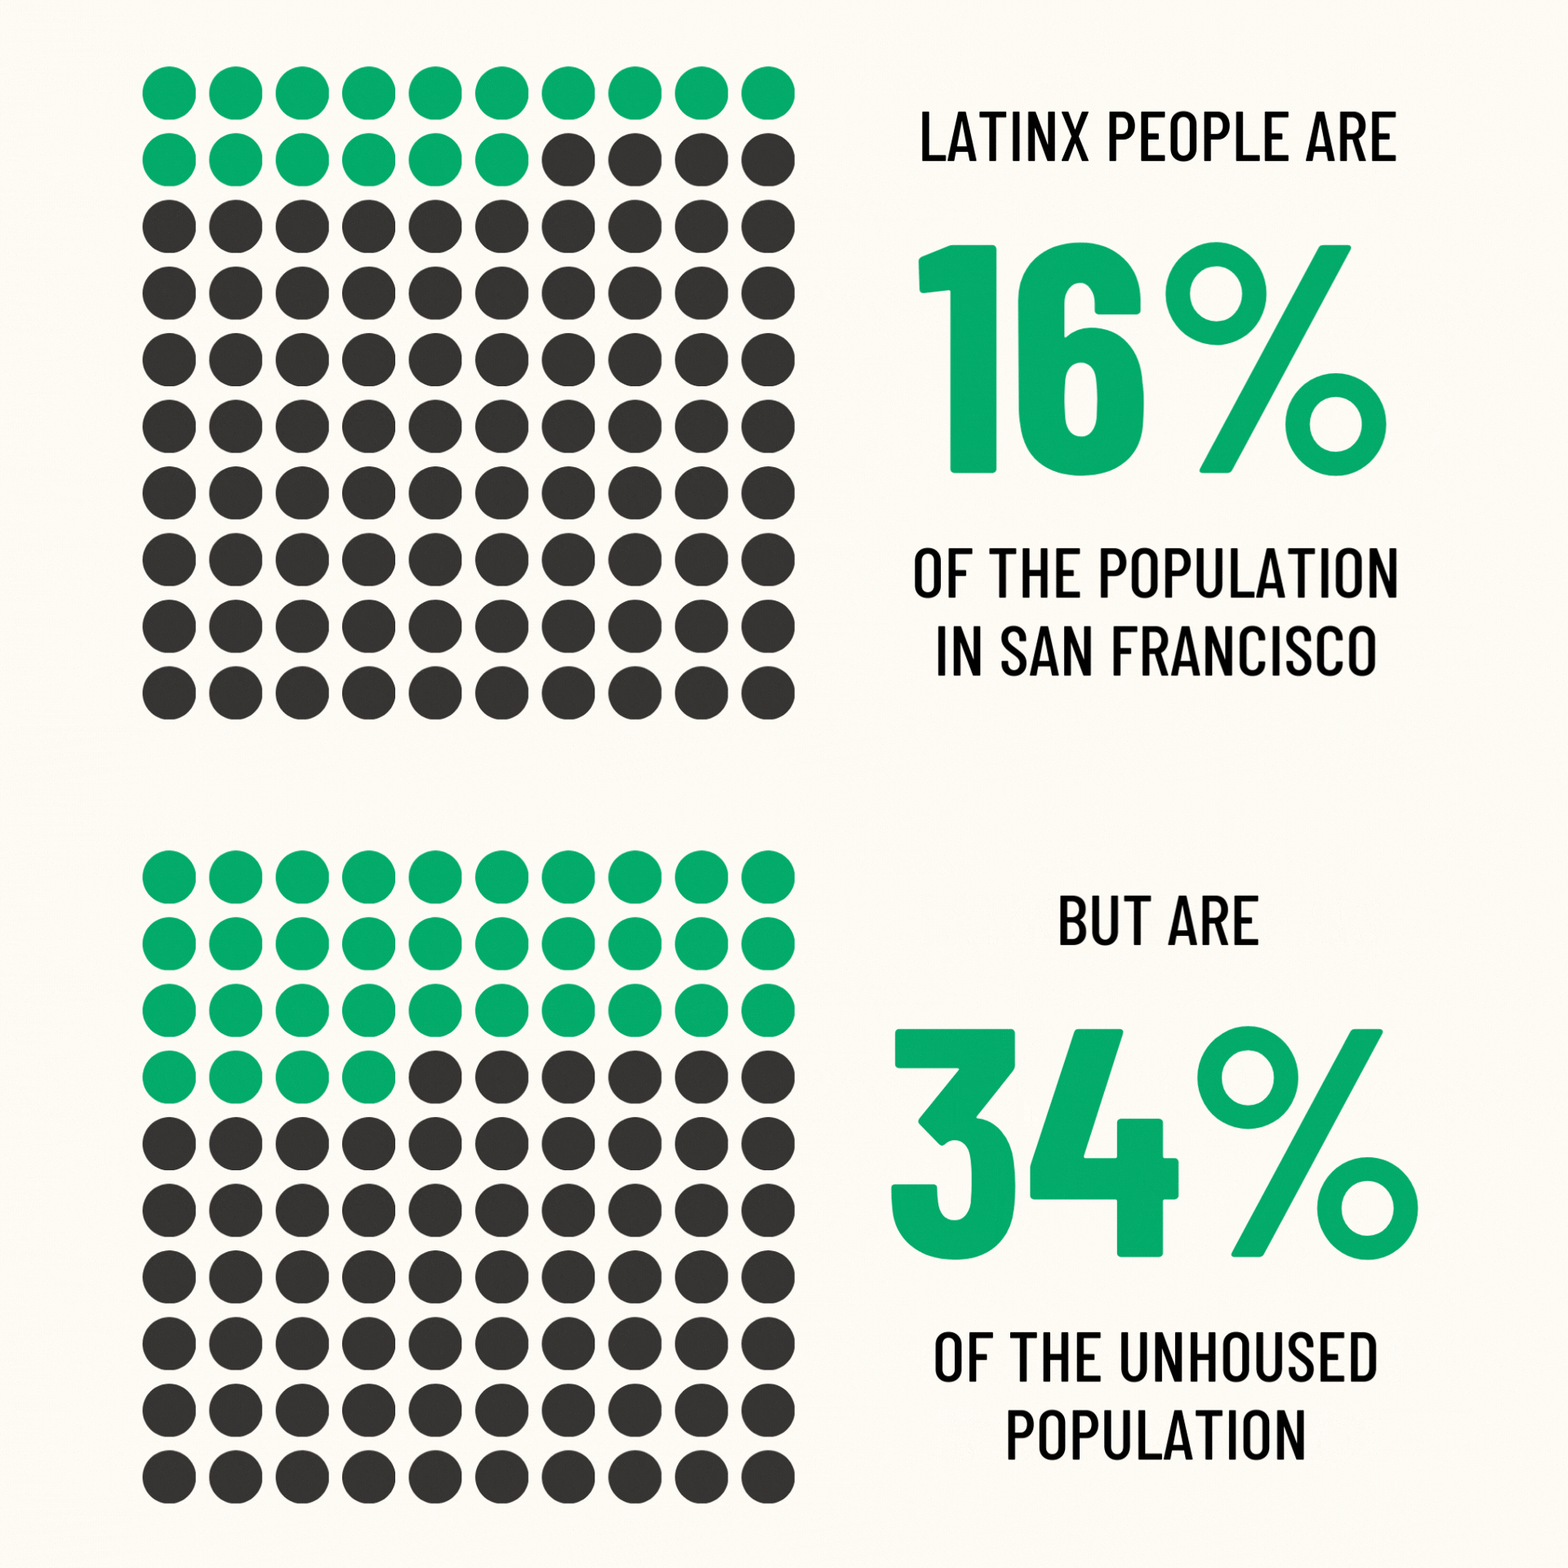
In its plan, the City commits to being guided by the expertise and recommendations of people with lived experiences of homelessness, particularly from communities of color. This is important because these people are the consumers of homelessness services, and know most directly what forms of services are more likely to lead to long-term housing stability. For example, Black and Latinx San Franciscans who disproportionately experience homelessness may be better served through programs that socially and culturally meet their needs.
As the City’s plan notes, “Because racism is woven into the structure of the systems that have produced housing instability and homelessness, racial equity is the common thread in every solution to homelessness.” The City’s first step is to report on baseline data about the current state of disparities in homelessness, with a focus on disparities in outcomes achieved by City-funded programs.
DISPARITIES BY RACE
CLICK THROUGH TABS TO VIEW DISPARITIES FOR EACH RACE & ETHNICITY


BLACK UNHOUSED POPULATION DISPROPORTIONALITY TRACKING
LATINX UNHOUSED POPULATION DISPROPORTIONALITY TRACKING
- Similar to the U.S. Census, HUD gathers data on race and ethnicity for the Point in Time count via two separate questions. Because of this, the percentages do not equal 100.
- Percentage of people experiencing homelessness in San Francisco by race & ethnicity: These data are taken from the Point-in-Time (PIT) count reports which HSH completes every other year. Please note that there was no PIT count in 2020 or 2021 due to COVID.
- Historical percentage of San Francisco population by race & ethnicity: These data come from the US Census Bureau DP05 charts.

